
Scale Buildup Detection and Characterization in Production Wells by Deep Learning Methods
Investigator: Jingru Cheng
Background
Inorganic scale results from brine solution deposition onto the surfaces of the reservoir, wellbore and other production facilities. In this project, we focused on studying scale deposition in the wellbore, which can introduce decrease in tubing ID and induce abnormal production declines and pressure drops. There are limited recent studies focusing on scale deposition detection, while most of them only managed to detect the problem after considerable production declines. Therefore, as the objective of this work, we tried to implement deep learning methods to detect the scale deposition immediately after its occurrence, and to estimate the magnitude of the scaling to help with the further design of its removal.
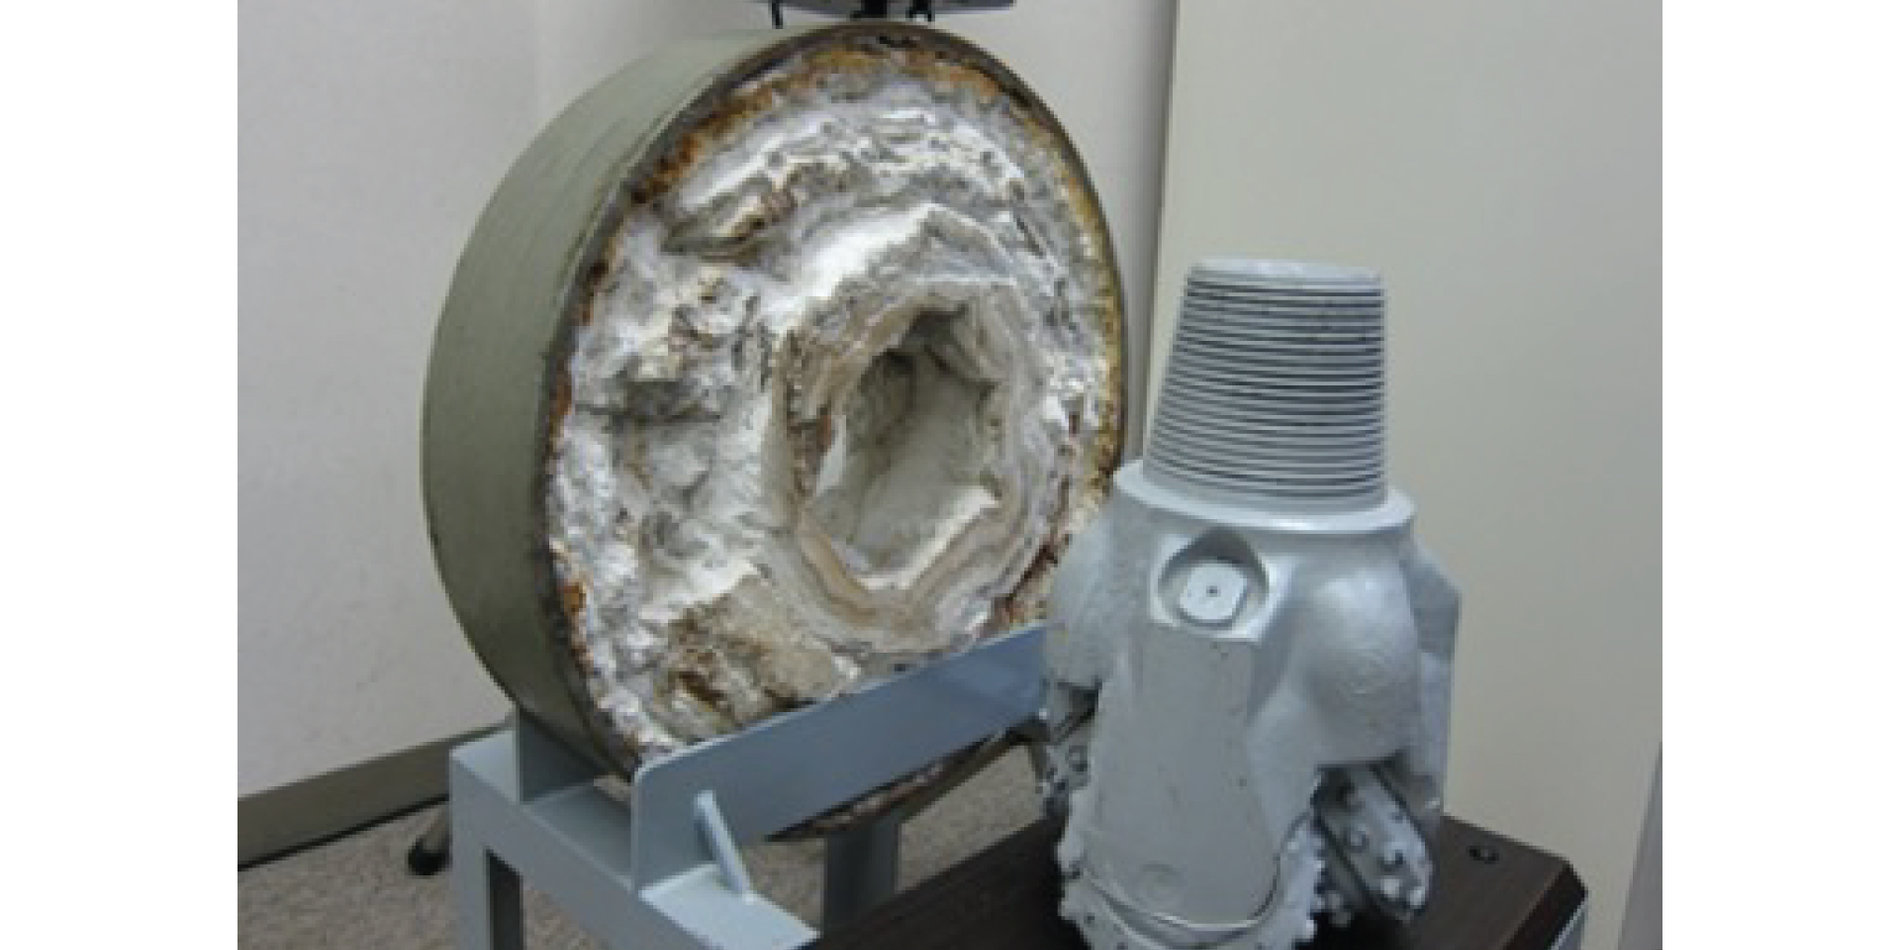
Figure 1: An example of scale deposition
Data Specification
This work used synthetic data generated by an integrated system model using the Integrated Production Modelling software (IPM) developed by Petroleum Expert (Petex). Two series of data were generated separately corresponding to two different circumstances, namely full scale deposition over the whole wellbore and partial scale deposition which only happens at some depths of the wellbore. We obtained rates of all phases (oil, gas and water), pressures (wellhead and downhole pressures), water cut, wellhead temperatures and many other well data from the simulations, and further used them as our deep learning model variables.
Full scale deposition
The first trial of utilizing the deep learning approach to detect full scale deposition was on the synthetic data with and without scale deposition. In this case, a small tubing ID change of 0.1 inch was set to assure the detection with high sensitivity. As only limited data were available, a simple convolutional neural network (CNN) model was used to solve this problem. With 785 short time series sampled by sliding window from original dataset, we could achieve an accuracy of around 75% for the classification of data with and without scale deposition.
As the actual scale deposition is a continuous process, detecting scale deposition by a time series has the possibility to overfit the model to the simplified scaling patterns, a combined point-wise model was built and developed for both the classification and regression of the full scale deposition here. As our main goal was to develop an automatic algorithm to detect scaling at the very beginning with high sensitivity, we focused on the smaller scaling depositions more than the larger ones. Thus, we assigned larger increments (0.5 inch) for the large scaling deposition and smaller increments (0.1 inch) for the mild scale deposition. This sudden change made it more reasonable to develop a combined model connecting results from two deep learning models focusing on smaller and larger scale deposition. The workflow of the combined point-wise models for classification and regression tasks are shown in Figure 2.

Figure 2: Workflow and structures of the combined model
Multiple experiments based on the combined model with different combinations of variables were conducted, results are shown in Figure 3 and 4. As a conclusion, all different combinations assured quite good performance of the model.
|
|
|
Regression |
Classification |
|||
|
Combination |
Features |
Overall accuracy |
R2 |
NRMSE |
Accuracy |
|
|
Part 1 |
1 |
qoil, qgas, qwater, ∆P, WHT, WCT |
91.2% |
99.3% |
0.0191 |
95.7% |
|
2 |
qoil, qgas, qwater, ∆P, WHT |
88.0% |
99.0% |
0.0228 |
94.9% |
|
|
3 |
qoil, qwater, ∆P, WHT |
79.2% |
99.2% |
0.0217 |
96.5% |
|
|
4 |
qoil, qgas, qwater, ∆P |
81.0% |
98.9% |
0.0242 |
94.9% |
|
|
5 |
qoil, qwater, ∆P |
78.0% |
98.8% |
0.0247 |
88.1% |
|
|
Part 2 |
6 |
qoil, qgas, qwater, WHP, WHT |
84.4% |
98.6% |
0.0271 |
95.9% |
|
7 |
qoil, qwater, WHP |
78.1% |
98.4% |
0.0288 |
94.5% |
|
|
8 |
qoil, qgas, qwater, WHP |
80.1% |
98.7% |
0.0255 |
92.7% |
|
Figure 3: Metrics for models with the five combinations of features

Figure 4: Regression results with different combination of features
Partial scale deposition
To simulate the partial scale deposition, we set different locations (depths) and lengths of the segments where scale deposition happened to approximate the depth of common subsurface safety valves used in the field. To mimic the gradual changes of the tubing IDs in real cases, we set the tubing ID changes from the initial 4.5 inches to 2.5 inches in increments of 0.5 inch, and then from 2.5 inches to 2 inches in increments of 0.25 inch as shown in Figure 5.

Figure 5: Depths and lengths of the simulation cases in the second series
A classification of the occurrence of the partial scale deposition is obtained by a CNN-LSTM model with the help of a residual block as shown in Figure 6. Residual block with skip connection was used here to avoid losing significant information over layers as we only have limited data for this task. We kept all the seven features used for full scale deposition, added one extra feature time (t) considering our input are time series instead of time points. An accuracy of more than 90% could be obtained on test set for this classification problem.

Figure 6: Structure of the model to detect partial scale deposition
Based on the successful detection of partial scale deposition, a much deeper multioutput CNN-LSTM model was used to quantitatively study partial scale deposition by extracting its tubing ID changes and the lengths of the scaling sections. A demonstration of the simplified three-dimensional model describing the volume changes due to partial scale deposition and the structure of the multioutput model are shown in Figure 7. The multioutput model could accurately predict the tubing ID changes from the production data and approximately classifying the lengths of the scaling segments as shown in Figure 8.

Figure 7: (Upper) Three-dimensional model to describe the partial scale deposition (Lower) Structure of the multioutput model for partial scale deposition
|
Test/Validation set |
R2 for tubing ID regression |
Accuracy for length classification |
|
Validation |
94% |
73.9% |
|
Test |
96% |
72.6% |
Figure 8: Results for the multioutput model
In the future, to conduct a more thorough study about the partial scale deposition and to train a more accurate model on predicting the lengths of the scaling parts and even the depth of it, more cases with a wider distribution of partial scaling segments lengths and depths will be required. More field data will also be helpful for the refinement of our model for more realistic uses.